Make Your Code Faster: Profile, Fix Bottlenecks, Repeat
How do I make my code faster?
Speeding up code usually comes down to two things: finding where time is actually being spent and removing unnecessary work. Guessing leads to random micro-optimizations that often don’t move the needle. A faster approach is to measure first, then make targeted changes that reduce CPU, memory, network calls, or disk I/O.
1) Measure before changing anything
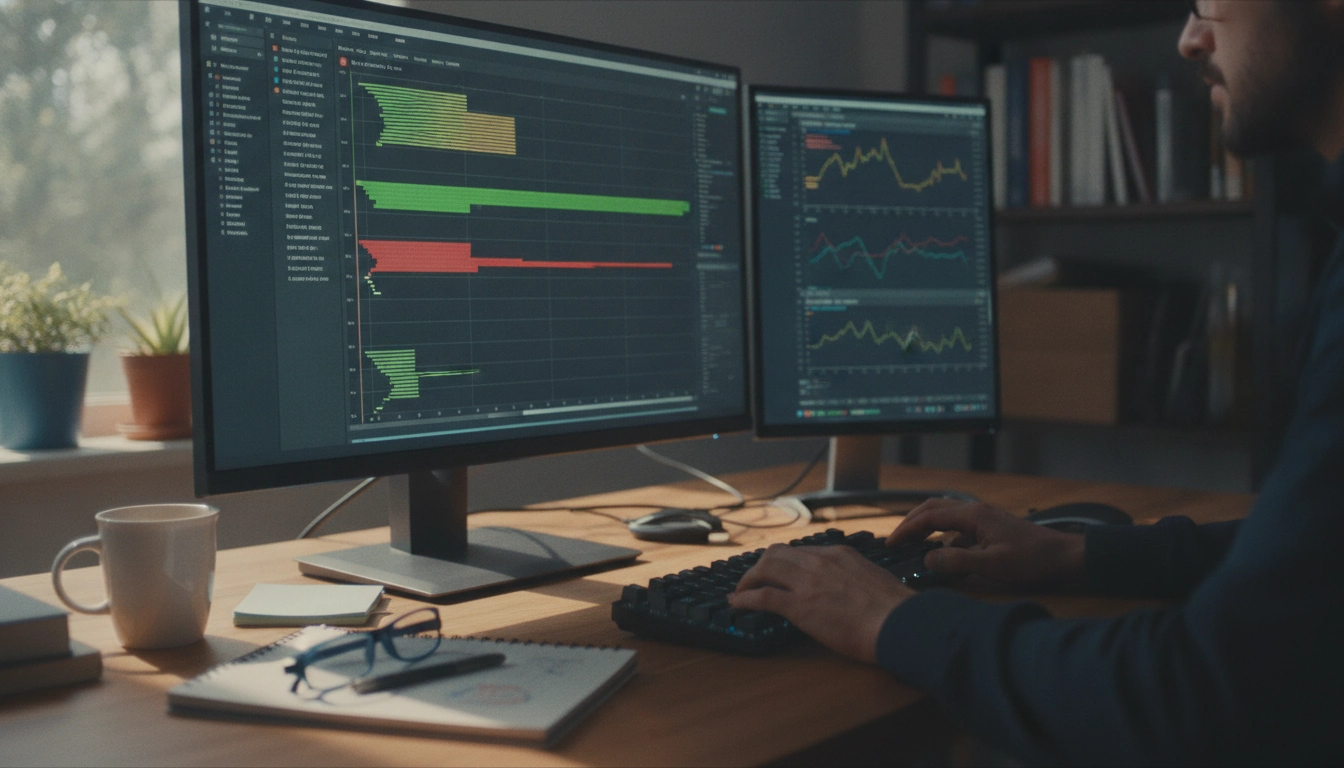
Start by reproducing the slow behavior reliably, then use a profiler (or built-in performance tooling) to capture where your program spends time. Look for “hot” functions, tight loops, excessive allocations, repeated parsing/serialization, and slow queries. Record a baseline (for example, request latency, page load time, or job runtime) so you can confirm improvements.
2) Fix the biggest bottleneck, not the easiest one
Prioritize the largest contributor to latency. Common high-impact fixes include reducing database round trips, adding missing indexes, caching expensive computations, batching API calls, and eliminating unnecessary repeated work inside loops. If concurrency is safe, parallelize independent tasks—otherwise focus on making the single-threaded path cheaper.
3) Reduce work per operation
Replace repeated computation with memoization or caching. Avoid creating large temporary objects in hot paths. Prefer streaming over loading entire files into memory when data is big. For web apps, compress payloads, cut down response size, and avoid repeated requests by caching and sensible headers.
4) Use a disciplined debugging workflow
Performance problems are still bugs—just with time as the symptom. A structured workflow helps: reproduce, isolate, test hypotheses, and verify with measurements after each change. For a practical, beginner-friendly workflow (including how to use AI to speed up diagnosing issues), read the full guide here: https://epherian.com/guide-beginner-debugging-workflow-fix-bugs-faster-with-ai/.
5) Confirm the win and prevent regressions
Re-run the same benchmark or profile after each change and compare to your baseline. Add a performance test, timing metric, or monitoring alert so the slowdown doesn’t quietly return later.
FAQ
What’s the fastest way to find a performance bottleneck?
Use a profiler on a reproducible slow case and sort by time spent. Fix the top hot spot first, then re-profile to confirm the bottleneck actually moved.
















Leave a comment